Showing posts with label FOREX THEORY. Show all posts

Saturday, September 23, 2006

Theory: When To Trade?

The question quite often comes up about when are the best times to trade? Everyone has their own ideas on what they think is the best time to trade, and quite often it depends on what type of system you are using. If you run a system that looks for trends, the best time for you would be different for a system looking for breakouts.

Rather than get into all that however (again just google "best forex trading times" for plenty of info on that) let's look at the best times to trade based on your experience instead.

A beginner, I would think, would be someone new to the forex markets, someone who has yet to fully develop their trading system, or, if they have, find it hard to maintain the discipline to stick to it no matter what. Some things that might identify a beginner trade could be:

  • Unaware of stop losses
  • Unsure of trend identification
  • Looking at one timeframe only (probably the 5M or 15M)
  • Quick to jump into a trade, slow to get out
  • Hazy on when to exit a profitable trade
Please don't think I am talking down to anyone, as some of the above applies to us all at times but these are things that I see encapsulate beginnner traders.

With those points in mind, the safest trading time would be one where:
  • The chances of big losses are low
  • You have time to think you trades through
  • There are some defineable trends to help you out in getting on the right side of the trade
  • Sharp, quick movements in the opposite direction to your trade aren't common
The markets can move so quickly, and any trade placed without a stop loss, is open to a sharp reversal and a big loss. Head out for a cup of tea, come back and your +10 could now be -50 by the time the kettle has boiled.

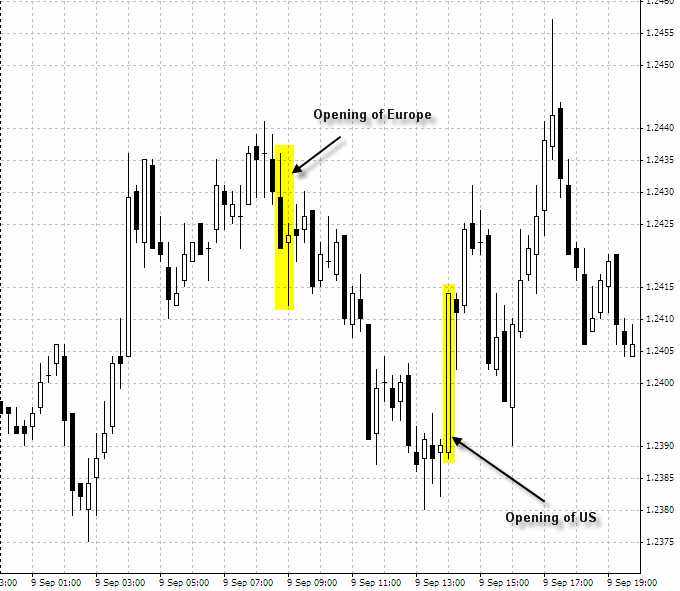
So when is the best time to trade based on the above? Well lets look it another way, what are the times where the above points are not met. My opinion? The opening of the different markets! There are three major markets to look out for, the Asian market, the European market and the US market. The opening and closing of these markets are often the most volatile, with sharp movements up and down with no apparent order quite often seen and many a beginner trader crying foul over a sharp reversal on their trade they have just been watching for the last hour.

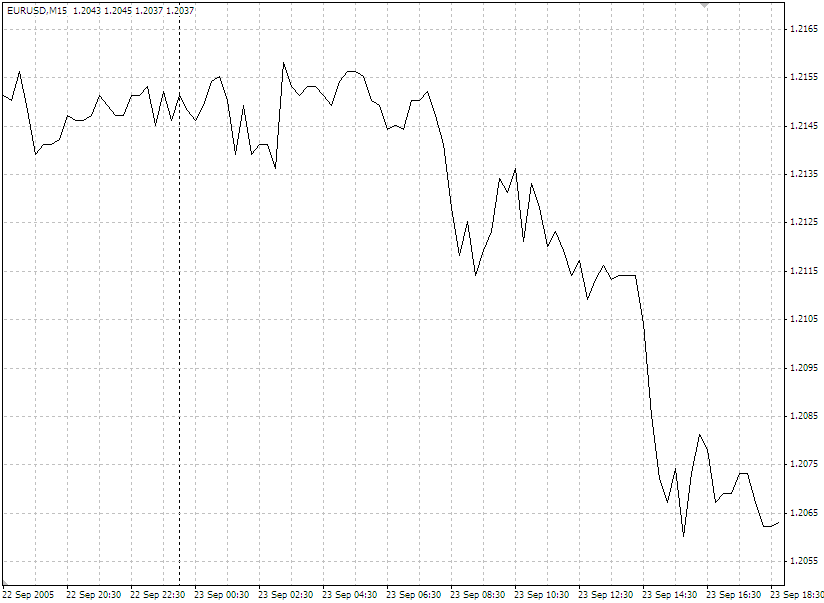
Look at the above chart, this is a 15M chart from late last week of the EUR/USD. I have highlighted two areas, which is the opening of the European and US markets. Notice, how just before the opening of the price was slowly trending in one direction, but then, as the respective markets opened a sharp reversal sprung up in the opposite direction, taking with it many peoples profits I am sure, and spoiling many a traders tea. You find this espectially on the opening of Europe.

The best times for quiet, trending activity tends to be in the middle third of the trading sessions, the middle of the Asian session is a less volatile time, but can be too quiet for some. Approaching the opening of the European sessions, activity tends to pick up, but remember, be careful come opening time. I prefer the mid European session, but rarely get to trade it due to the time differences here in Australia, the mid US session can also be good but usually I am so buggered by that time, my decision making is shocking.

So pick what you prefer, if you are in it for a fast buck and don't care about making it a possible career, then opening and closing times can be right up your ally, but if you want to test out a system you are developing, look at the mid session times that suit you. Remember though news releases and data can effect everything, so always keep an eye out on the news anytime you trade.

Remember, this is not necessarily the most profitable time to trade in terms of pip movement, but while you are picking things up, minimising the chance of your account being wiped out is always a good idea.

I hope this helps someone, you can get the current times in the different areas by using this great little forex clock here. For my fellow countryfolk in Australia, below are the opening and closing times in AEST (thanks to aaron on Marketiva for these):

[AUS open 8:00am close 4:00pm]
[JYP open 10:00am close 6:00pm]
[EUR open 4:00pm close 12:00am]
[GBP open 5:00pm close 1:00am]
[USD open 10:00pm close 6:00am]

Ill leave it with a quote I read somewhere:

"Ametuers open the markets, professionals close them"

Theory: When to Exit

..you actually make bugger all money if you can't execute and exit as precisely as you entered...

Hi all,
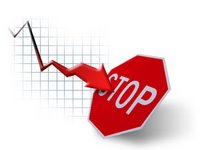
Welcome to another article, this time on when to exit a trade. When beginner traders start looking for that magic "make me a bucket load of cash" trading system, quite often the last thing thought about is their exit strategy. Usually the first and most important thing on a traders mind is when to enter a market, forgetting that you actually make bugger all money if you can't execute and exit as precisely as you entered.

There are three main scenarios that a trader will find themselves thinking of their exit:
  1. A trade has moved as expected and they are in profit
  2. A trade has moved opposite to what they expected, and they are in loss
  3. A trade is dancing around the neutral zone of their trade
At first glance, you would think the easiest scenario of the three to exit under is number 1, i.e. when you are in profit, after all you are "cashing in" so how hard can it be. In fact, in reality all three can be as hard as each other. The reason?, like most things with trading, it comes to emotion. Below I have added the underlying emotions that might stop you closing a trade under these three scenarios:
  1. A trade has moved as expected and they are in profit (GREED)
  2. A trade has moved opposite to what they expected, and they are in loss (OPTIMISM)
  3. A trade and dancing around the neutral zone of the trade (FEAR)
Let's look at them one by one.

Cannot close a profitable trade (Greed)
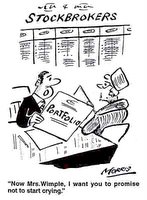
Everyone fights greed every day in life, always "wanting" rather than sticking to what you actually "need". It is part of a materialistic modern day culture that most of us are subject to. Trading is no different, and it is usually greed that can turn a nice logical, well planned and profitable trade into a losing one. When this happens, a trader reacts two ways, one, they are distraught at themselves for letting it all get away, or two, they tell themselves "well I was right with my prediction, the market just had it in for me".

Think of this, you set up a trade, monitor the setup closely, wait for the exact time to enter a trade, calculate your stop loss, your order is hit and you are in the trade. The price action moves beautifully, moving quickly towards your scantily thought about target (if you set one), and the sense of delight sends your brain into overdrive, working out the profits, imagining the ferrari soon to be in the drive-way, wondering if 2000 pips has ever been done in one day. This is when you know you are in some trouble, this is when greed has started to set in, you remove your profit target thinking "let's see how long this goes", you don't move your stop loss, cause you don't even contemplate that it might reverse, and you "go for the ride".

A common saying is "cut your losses, and let your profits run" (or something like that ;)), and it is a very good theory that should be followed. However, how do you ride your profits, without risking a reversal that you will undoubtedly put down to "a correction that will soon move back my way".

Personally I look at it this way:

  1. Move your stop loss to break even or better as soon as is logically possible without risking being whipsawed out, that will ensure you will not lose money on the trade, ease the stress, and bring peace to the world (ok maybe not that). I take the view of never let a winning trade turn into a losing one so at least lock in 1 pip if it makes you feel better.
  2. If the move was stronger that you anticipated, and you had a 20 pip profit target. Remove your profit target, and move your stop loss to the profit target as soon as possible. What you effectively have done is close your trade (because your stop loss is at your original target) and you are letting your profits run at the same time, two for the price of one, bargain!
  3. Continue to follow the trade with your stop loss, and remember, 20 pips was your target, be satisfied with whatever you can get after that, but don't take any less. You can use one of the many trailing stop techniques to do this or look at the parabolic SAR indicator.
Cannot close a losing trade (Optimism)

I was tempted to use the word "Dillusion" for this one but felt perhaps that is a little harsh, you know the deal, you enter a trade, you set a 25 pip stop loss, the trade moves the wrong way and you are -20 on the trade, you look at the chart again frantically, and optimistically think "Oh of course ... I should have set the stop loss beyond that resistance level from the year 1967, what was I thinking" and you change your stop loss, making it -35. The price continues to move in the wrong direction, and you either cop a -35 pip loss instead of -20, or you remove your stop loss all together and spend the next week driving everyone nuts asking "will the EUR/USD go up?" to every trader in the chat room.

... Some may say, that they removed their stop loss and eventually, their -100 pips turned into +10, so there .. stick that up your jumper ...

What you do when you move a stop loss further away from entry, is completely change the ratio of the trade you entered. What was originally a 2:1 trade, i.e. your potential gain was twice as large as your potential loss, becomes a 1:1 trade, which is just asking for a margin call very quickly.

My advice on this? NEVER NEVER (I think that is pretty clear) move a stop loss further away from your entry, you can move it closer or break even if you wish, as this improves your risk/reward ratio, but never away. Some may say, that they removed their stop loss and eventually, their -100 pips turned into +10, so there .. stick that up your jumper ... the only problem is, that while they waited the week out waiting for the price to turn around (sometimes it never does .. look at the USD/JPY at the moment) they have tied up the entire margin, meaning they are locked out of many many more potentially profitable trades. So while you might end the week at +10, in the meantime other trades cut their losses at -20, entered 15 more trades in the week, and finished +100 for the week and at the same time learnt a hell of a lot more.

You want to close a trade dancing around the neutral zone (Fear)

This one is different, this is when you have a trade at +1, 0 or -1 pips, right around your entry, and it hangs there for quite a while, what do you do? Do you take a really small gain of +1 "just in case" it turns? Personally, and this one is up to you, I say never close a trade around the neutral zone of a trade, the ultimate aim of a trader, is to see a movement before the majority of others, you can then get in early, and when the others have caught up, let them make you money.

If you have spent the time analysing a trade, trust your judgement, if you analysed correctly, you may have got in early and it will take some time for the others to catch up. Don't be fearful of a losing trade, instead trust what you saw in the first place when you placed the trade. Sure there will be times when you end up losing, but if you cut your losses and let profits run, then you will be well in front in the end.

... If a trade has moved 1 pip past your target (that you have not automatically set), why close it? ...


So that is it, to summarise:
  • Always assess your potential profit target, and close, or lock it in as soon as possible with your stop loss.
  • Never move a stop loss away from your entry price.
  • Don't be fearful you could be wrong, instead be trusting in that you are probably right.
One last little tip, I personally never manually close a trade when it goes my way, my trades are closed either by my profit target being hit as set, or preferably, because I have moved my stop loss to my target and I am following the trade from their on in. If a trade has moved 1 pip past your target (that you have not automatically set), why close it?, why not move your stop loss to the target point, at which point you the price will either close you at your target as you originally wanted (congratulations, well done, bravo!), or it will continue it's run and you are essentially "playing with the markets money". This exact strategy turned my trade last night on the USD/CAD from a +45 target trade to eventually it being closed out at +93, it won't work all the time but you have nothing to lose if your target is locked in.

Happy trading!
Theory: What To Trade?

... I can't tell you what to trade as much as the next person, essentially you need to make that decision yourself ...


Hi there!

Time for another theory article while the markets are quiet, this time on the first question asked by every new trader I see in the chat rooms, "Can someone tell me what to trade?". Now I can't tell you what to trade as much as the next person, essentially you need to make that decision yourself, not rely on others to tell you what to do, but we can look into how some currency pairs behave to give us a hint into what will suit you.

There are a multitude of currency pairs out there, pick a countries currency, and there will probably be a broker out there trading it, but what we want to look at is the most commonly traded pairs, or the majors as they are refered to. Below is a list of the major currency pairs most commonly offered:
  • EUR/USD (Euro/US Dollar)
  • GBP/USD (Pound/US Dollar)
  • USD/CHF (US Dollar/Swissy)
  • USD/JPY (US Dollar/ Yen)
  • AUD/USD (Australian Dollar/US Dollar)
  • USD/CAD (US Dollar/Canadian)
Now what do you notice is the common theme through them all? Yep the USD, all the majors either have the USD as the base currency or are matched against the USD. You will find the above list will also have the tightest spreads (see Forex 101 for an explanation on spreads) with most brokers, and will have the biggest daily ranges (difference between the daily high and low).

So what to trade?, if you are a beginner trader, without a tested and trusted system in place, it would be best to choose a couple of these pairs only. More than 2 or 3 will more than likely confuse the buggery out of you, and the last thing we need is to trade confused (I live my life confused, so I would rather not trade that way ;)).

The GBP/USD (known as the "cable") is very popular amongst traders as it tends to have the highest daily range, giving up more pips in it's moves than any other on average. The EUR/USD is also popular as it tends to have the smallest spread with most brokers, why the USD/CHF is another that has some substantial movements.

... as you trade you will start to notice the relationship between the different majors ...


Quite often which pairs you choose might be to do with when you trade. If you tend to trade the asian session the most, the pairs that include asian or oceania currencies would be a good choice such as the USD/JPY, AUS/USD or even, while not a major, the NZD/USD. Those trading the european session of course might choose teh EUR/USD or the GBP/USD, which just about all the majors are ok to trade during the US session.

As you trade you will start to notice the relationship between the different majors, such as how the EUR/USD and GBP/USD tend to mimmick each other, and that if the EUR/USD is going down, then more than likely the USD/CHF is going up. This of course is because they both have the USD as part of their pairing, so if the USD is getting stronger, the EUR/USD will be moving down (Euro getting weaker against a strengthening USD) and the USD/CHF moving up (USD strengthening against the Swissy).

The only exceptions to this relationship will be when country specific news is released, such as a good economic meter reading in switzerland might move the USD/CHF but not the GBP/USD and so forth.

Whichever you choose, there is money to made and lost just as quickly, so be sure to keep your money management tight and your head clear.

Happy trading!

Theory: Trend Lines

Hi all!

Time for a new theory article, this time on a very basic, but incredibly usefull tool of trend lines. Now for Marketiva users, at present you cannot draw freehand trend lines on their charts, but I have it on good authority that this feature is not too far away, so you may need to look at some online charts or other charting packages to use this tool.

Trend lines form the basis of my trading system presently (along with support and resistance lines), and can give you a good insight into where prices are going, and in which direction. They can also be used to see when a trend might be breaking but I'll go into that a little later.

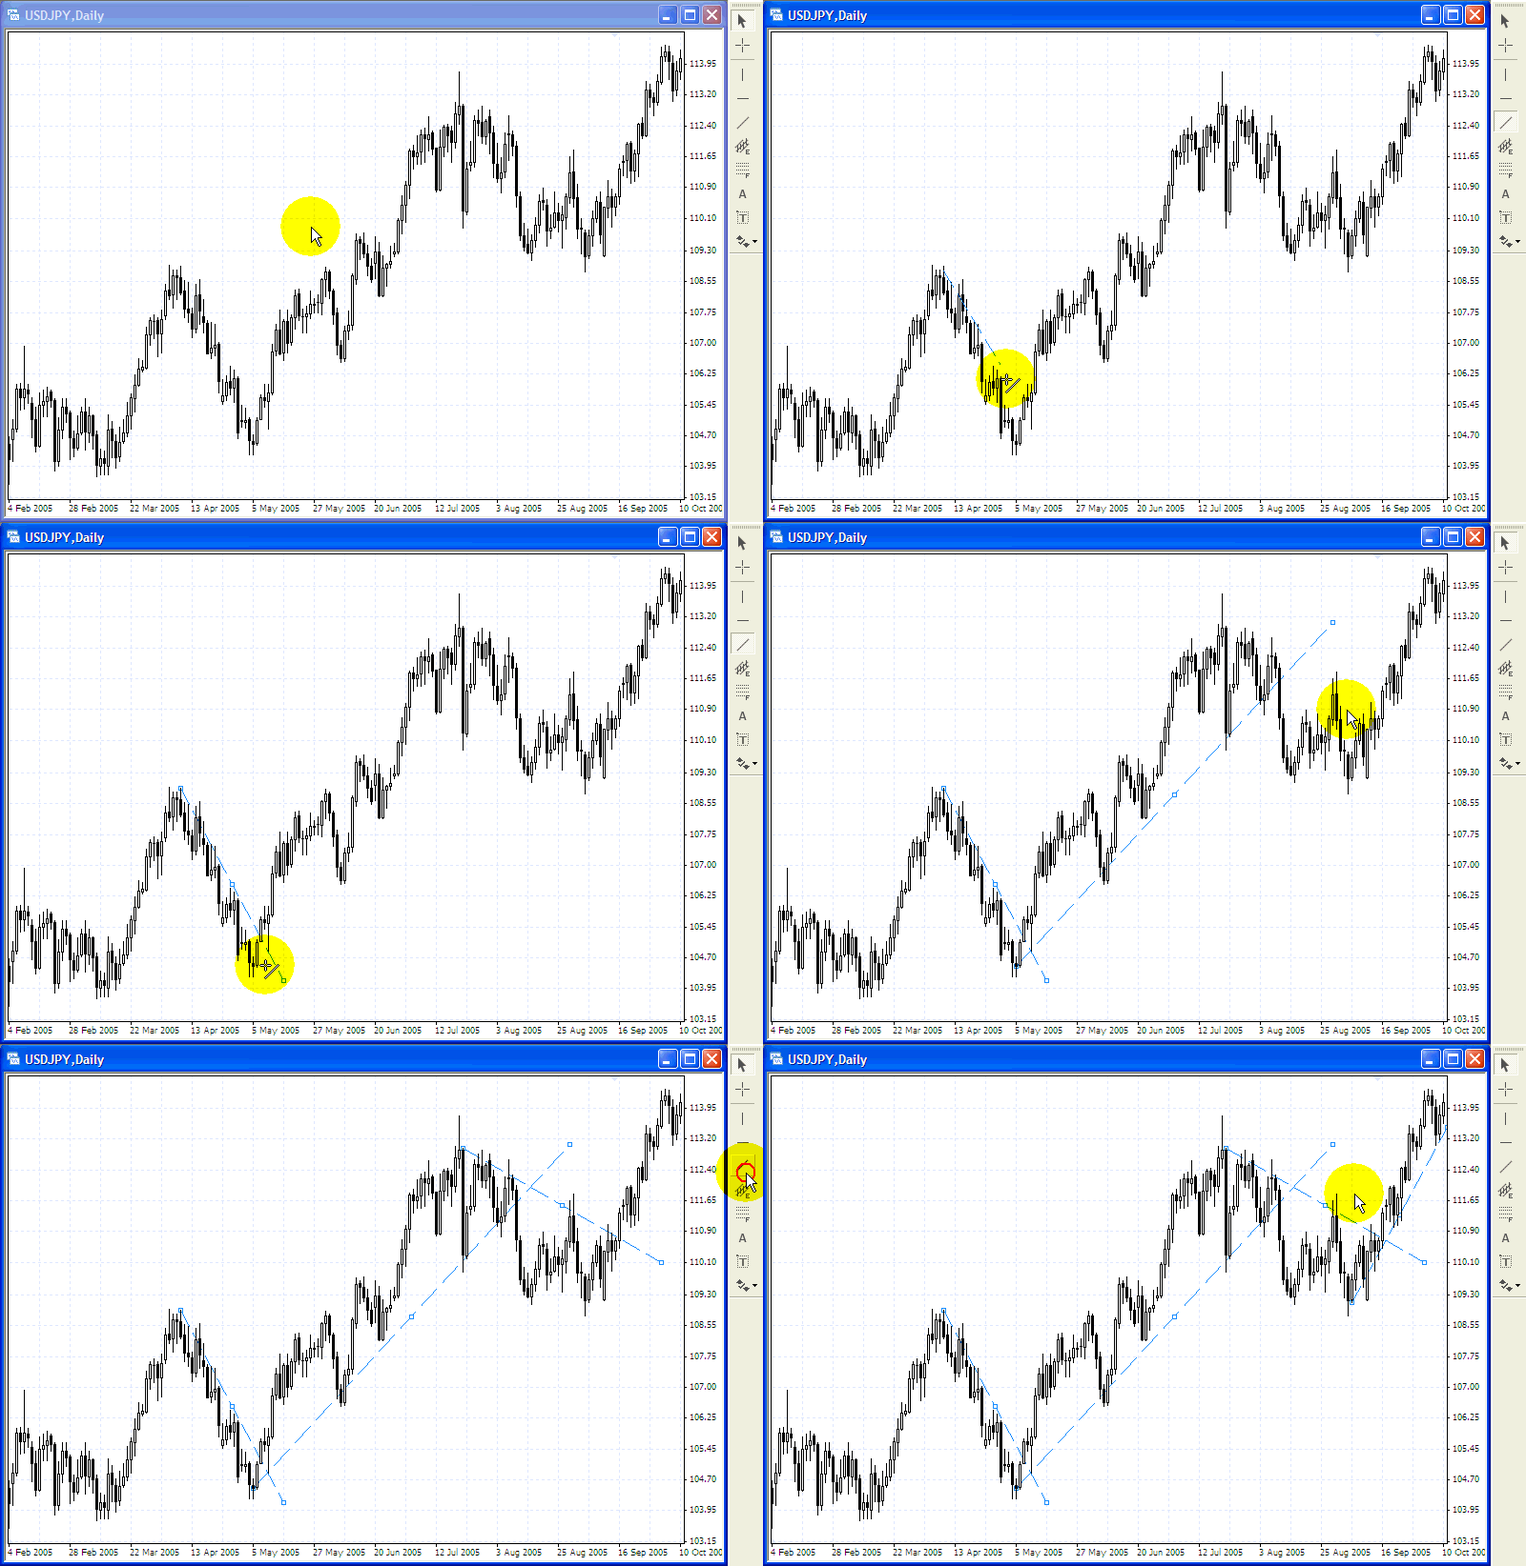
Ok first a chart from Friday just gone (click on it to see the animation):


What you seeing here (click on the thumbnail to see it animate) is the USD/JPY daily chart, and on it I am drawing four different trend lines. In a down trend, i.e. when the price is making lower lows, and preferable lower highs, you draw your trend line across each peak, the opposite applies for an uptrend, where you draw a line across the troughs. Look at the above chart to see what I mean.

... never consider a break of a trend line to be valid unless the prices closes outside the trend line ...


The basis of trend line studies, is to see what the overall trend is, and also to identify areas were the trend may be failing. In the above chart, there are four areas where a trend line was broken, in this case, you can see clearly that for a time the price then moved in the other direction, netting a very tidy profit if you read your exit correctly. Another way to trade using the trend lines is to use them to identify where the price may turn back towards the underlying trend, especially if it coincides with a support or resistance level, or a fibonacci line.

Now granted, that every trend line break does not prove to be valid, so be sure to confirm it with other tools, and I never consider a break of a trend line to be valid unless the prices closes outside the trend line on the timeframe my trend line was drawn on. You can draw trend lines on any timeframe, and a useful thing to do is draw your trend lines a timeframe or two above what you trade off, for example, if you trade off 1H charts, draw your trend lines from the 4H or daily charts. This will show you the underlying trend, and keep you in the right side of a trade more often than not.

Best of luck with this simple yet effective tool.

Happy trading!

Theory: Trading The News

... to ignore major economic news releases is asking for a slap in the face with a dead fish, quite unpleasant ...

News, most people watch it, many want to be in it, but how many trade it? I am writing this a day after some poor housing data in the US saw the USD get kicked, mashed, belly flopped, chinese burned (the most painful) and jumped on to the tune of 200 or more pips against the majors within a couple of hours, bringing many to wonder just what in the world happened!

While I consider myself a technical trader, it is became apparent very early in the piece, that to ignore major economic news releases is asking for a slap in the face with a dead fish, quite unpleasant. The problem is, if you are like me and read the newspaper back to front (i.e. Sport, Comics, News), then you don't really want to read the latest financial news to keep up with things. Well instead of doing that, I will run you through the main fundementals, what they typically mean for a currency, and where you can get the results.

It is essentially a pretty bland subject, but here we go in real simple terms:

  • Unemployment figures
    What: Measure of unemployed people in the country looking for work.
    Better than expected: Currency may strengthen
    Worse than expected: Currency may weaken

    E.G. Japanese unemployement figures worse than expected, JPY to weaken against other currencies, so the USD/JPY would go up (USD strengthening against the Yen/Yen weakening agains the Dollar).

  • GDP
    What: Gross Domestic Product, a broad measure of economic growth of a country.
    Better than expected: Currency may strengthen
    Worse than expected: Currency may weaken

    E.G. US GDP figures show the economy is growing, investors take this as a positive sign for the country as well as a hint that interest rate rises may be needed at some point, investment in the US dollar follows, pushing up pairs such as USD/JPY, USD/CHF and bring down EUR/USD and GBP/USD.
  • CPI
    What: Consumer Price Index, derived from comparing a set basket of goods over a period of time to see if prices have increased, resulting in increased inflation for consumers.
    Increases: Currency may strengthen
    Decreases: Currency may weaken

    E.G. Australian CPI figures come in lower than previous, this indicates that the economy is slowing by itself, meaning the Central Bank will not need to increase interest rates to slow it artificially. Would result in the Aussie dollar losing some of its value as funds are moved elsewhere, resulting in the AUD/USD dropping.
  • Consumer Confidence
    What: A measure of near term spending habits of a countries consumers.
    Up: Currency may strengthen
    Down: Currency may weaken

    E.G. German Consumer Confidence shows an increase from previous, this is a sign that the people of that country feel positive about the economy and their financial situation, indicating that there will be increased spending, which would strengthen the economy and push something like the EUR/USD up.

  • Retail Sales
    What: As the name suggests, measures the retail activity, ties in with Consumer confidence somewhat.
    Up: Currency may strengthen
    Down: Currency may weaken

    E.G. Japanese Retails Sales are up, showing that their is increased spending, showing the economy is in good shape, consumer confidence must be good, and so the currency will strengthen, so USD/JPY would go down (USD weaker against a strengthening JPY).

  • Trade Balance
    What: It measures the difference between total imports and total exports of goods in a country.
    Up: Currency may strengthen
    Down: Currency may weaken

    E.G. US shows a positive Trade Balance reading, this means that more goods were exported from the US, which is a good thing for the economy, therefor strengthening the USD, so EUR/USD would go down, the USD/CHF would go up.

  • Interest Rates
    What: A tool to slow an economy or encourage spending.
    Up: Currency may strengthen
    Down: Currency may weaken

    E.G. Like all of us, we want to invest cash into high interest earning areas, so if a countries interest rates are increased, money is moved to that country, resulting in it's currency strengthening substantially usually. So if US interest rates are increased, then the USD/CHF for example would rise.
So there are some basics, there are so many data releases, barometers and speaches it is not funny, and quite frankly, I couldn't be bother keeping up with what they all actually are, as I have better things to do than listen to some old bugger spitting figures at me, but I do take note, and tend to think of data releases in terms of interest rates. If the data release is indicating the economy is speeding up, it hints that there will be a need to increase interest rates to slow it down before inflation takes hold. Of course the opposite applies as well.

Ok finally, here is yesterday's chart to demonstrate what I am talking about:


Here you can see the effect of another data release not listed above, US House Sales. The release was much worse than expected, with US House Sales dropping considerably, this mean to some that it is a sign people don't have as much money to spend, hence a slowing economy and less chances of interest rate hikes in the near future. This meant a sharp reversal of the short term trend, and, coupled with a positive speach in Europe of possible interest rate increases there, the EUR/USD moved over 200 pips in a couple of hours!

This movement was spread across the board across all pairs with the USD, and was really a "no brainer" trade for those awake to see it.

So you can see that there is value in keeping one eye on upcoming releases, one to cash in on the moves if you are experienced with money management and the fundamentals, and two to tighten stops on any open trades that are in the perceived wrong direction to the data release. Be sure to check that your broker has a guarenteed stop policy otherwise this will not work.

One final and very important note, remember that figures are always compared to the "expected" figures, so while a release might come in below the previous, if this was expected anyway, it may already be figured into the price and the movement may be small or non existant. In some case, price can move in the opposite direction if an underlying fundamental is stronger than the data released. Confused? .. if so ... then you probably shouldn't trade the news just yet.

Best of luck with it, below are some links to economic calendars that will help you keep up with things (also in the menu on the right):

Forex Factory Economic Calendar
Forexnews.com Economic Calendar

Happy trading!

Theory: Trade Logs

Hey all,

Well we spend so much time working on our trading systems, on when to enter, exit, move stop losses, take profits etc. etc. but how much time do we spend reviewing trades we have placed. I dare say many of us (me included at times) kind of forget about this part of the process, especially when you are on a series of profitable trades, the last thing you are thinking about is looking back at past trades.

... the irony is, if you are using any type of indicator in your trading system, you are actually trading the present based on the past ... so why shouldn't you review your trades in the same way? ...

A lot of traders only bother thinking about the past when things start going wrong, and usually it is something like "Ah yes, I remember back when I used to make money from the markets ... those were the days ...". So why should we bother looking back, living in the past so to speak? Aren't we supposed to be living in the present, looking to the future? The irony is, if you are using any type of indicator in your trading system, you are actually trading the present based on the past, as all indicators take past data, compare it to present conditions, apply some odd formula like, x+y/2*45 + your dogs age - your height, and then draw a squigly line or an arrow of some sort based on that historical data. So why shouldn't your review your trades in the same way?

The simplest and easies method of keeping track of how things have gone, and how they are going is through a trading log of some sorts. There are many ways you can do this, you could simply just write your trades on paper, or keep them in a spreadsheet, or simply add comments to your trades if your trading platform allows it and print out a monthly report. Whichever way you do it, the important thing to ensure is that what you put in your log is useful, so let's look at that.

So what should we include? Well I can only speak for myself, but here are things I have contained in a simple excel spreadsheet, with an explanation on why I include them:

  1. Open date
    This is the date that a trade was opened, useful if you want to look back and see if you are more successful on one day more than others.
  2. Open time
    The exact time of the trade, like above, to see if your trades a more successful during different times of day. You could use this to see if you trade better in a certain session, such as Asia, Europe or the US sessions. I used this to notice my strategy worked great during the Europe and US session, but performed miserably during the Asian session, which brought me to adjust things and now things are much better.
  3. Mood
    Never underestimate the power your mood can have on your trades. Write it down and be honest, you can then look to see if you have more success trading when you are happy, sad, angry, tired, alert or constipated (I don't trade well constipated trust me ;).
  4. Pair
    Of course keeping track of what currency pair you trade will soon identify your favourites, your most profitable and your most hated.
  5. Direction
    Long or short, you may be surprised by which one you favour more, for example last month 83% of my trades were short!
  6. Open price
    Price you opened your trade, a basic thing to keep track of.
  7. Stop loss
    Very useful to see what your stop loss to wins ratio is. If you are finding your wins are much smaller than the potential stop losses, it may keep you aware that a string of losses could wipe you out, so some adjustments may be needed with either riding the trade longer, adjusting your entries, or tightening your stop losses.
  8. Take profit
    As per above.
  9. Close price
    The price you closed your trade at, useful to see what your average winner versus average loser is.
  10. Closed date
    I like to keep track of these to see how long I am keeping my trades for and what it means for profits or losses.
  11. Closed time
    Again, useful to see if there is a certain time of day you seem to be closing your trades at the most, are you closing them cause you are tired and it is late at night for example?
  12. Balance
    What you made on that trade, if it is a profit, make it nice, big and green, visual reward can really be satisfying and a good motivator.
  13. Comments
    Can be potentially the most useful part, be honest with yourself, and jot down anything about the trade you liked or didn't like. Some people will only focus on the things they did wrong in a trade, but be sure to put things you did right as well, as they are just as useful if not more so for future trades.
So that is how I keep track of my trades, while it takes a little effort, it really is worth the trouble, and your trading will benefit for it. Remember though! look back on it, no use keeping your trades logged but never looking at it. The markets are closed over the weekend, so that is a good time to have a quick look through and ready your mind for the upcoming week.

Ok, I have attached a sample trading log for you all, it is a simple, unformatted excel spread but it might help someone. If anyone is good with programming excel, you can program the balance etc. to update by themselves, and please, if you make improvements, let me know so we can share it with everyone

Theory: Stop Loss Placement

Anyone who has chatted to me or written me emails will know that one of my big things is stop losses and the importance of them. I have many a debate about the topic, a classic conversation would go (usually from the same trader a couple of days in a row):

TraderJoe: Akuma ... do you think the EUR will rise today?
Akuma99: Not to sure just yet ... need to wait for support to hold

TraderJoe: What about tomorrow .. you think it will rise tomorrow?

Akuma99: Well there is some US data tonight that could effect that

TraderJoe: How about by the end of the week?

Akuma99:
TraderJoe are you holding a long position?
TraderJoe: Do you think it will go to 1.2300 by the end of the week?

Akuma99: What trade do you have? What was your entry?

TraderJoe: 1.2290

Akuma99: Long or short? ... What was your stop loss traderjoe?

TraderJoe: Well long, and I don't use stop losses, I don't like to confine my trade

Akuma99: Well there is a fair way to go before we see 1.2300, need to see if 1.2200 holds for now

TraderJoe: So you think it will rise right?


... and so it goes on, usually every day for rest of the week as prices make up their mind .... this is usually then followed by this conversation around a week later

TraderJoe: Hey Akuma ... remember me?
Akuma99: Ummm yeh sure

TraderJoe: Remember that EUR long position I had at 1.2290 last week, I closed it this morning at +10 .. see that is why I don't use stop losses, eventually it comes around.

Akuma99: Well done :) ... how did your other trades go?
TraderJoe: I didn't take any other trades ..


.... so we end that conversation with TraderJoe convinced a no stop loss policy is the best way to go, and look if it works for TraderJoe, then all power to him, but what is the main problem with the above scenario?

... suck it up, place your stop losses and be prepared to be wrong, there is no pride to be stuck in losing trades that keep you out of the most lucrative market in the world ...


The main problem with this scenario is time! While TraderJoe did eventually close in profit, it took him out of the market for a week. In essence, TraderJoe traded a whole week for a +10 profit, sure his trading log looks better cause there are no minus figures this time, but the results are far from impressive and what has he learnt? For traders starting out on a highly leveraged account, as most are while they try to build an account quickly, margin calls become a real danger, so if a trade moves the wrong way and you find yourself in a trade sitting at -100, two things happen:
  1. You are locked out of the market as you risk a margin call if another trade goes the wrong way, meaning you miss a multitude of other opportunities for profitable trades
  2. You live in perpetual fear your account being whiped out by a news event.
If TraderSally happened to be trading at the same time, with stop losses in place for all her trades, and she ended the week with 10 winning trades, 8 losing trades, for a balance of +10 for the week, which trader do you think learnt the most about trading that week? Sure the results are the same, but down the track I really believe TraderSally will be further down the trading road to profitability. Stop losses I think are vital to keep your risk definable and your enjoyment levels up. Believe me your last losing trade is forgotton easily when you close your next profitable trade (a reason to keep trading logs).

So onto placing stop losses, there are many many theories on how to place stop losses, and rather than plowing through them all here, i'll point you to a great article written over at Globetrader's site here that spells it out better than I could. Instead I'll just explain how I think of my stop loss placement. I read a great comparison somewhere, of likening stop loss placement to a game of hide and seek, and it really is a very good comparison.

I ask myself three things when placing stop losses:
  1. Where can I hide my stop loss that people won't find it?
  2. At what point is my trade no longer valid?
  3. Where do I think things will go to?
Let's run through them:

Where can I hide my stop loss that people won't find it.
This is the hide and seek theory, there are traders, brokerage houses and market makers out there that look for stops, don't let anyone tell you anything different. They look for obvious stop placement areas, and push prices to them looking to trigger those stops for their own benefit. So how do you hide them?

Let's say prices are just below what you deem as a solid resistance level, you want to place your stop just above that resistance for a short trade, think about where all the other stops may be, most likely 1 or 2 pips above that resistance level. In this scenario, I would place my stop loss perhaps 10 pips above that level, on a 3 pip spreaded pair and look for a slightly better entry, perhaps with a stop order a pip below the resistance level to keep my risk the same. If prices honour the resistance, then you are in with a fantastic entry and no drawdown, if they test for stop's just above, you have some chance of them not finding your stop.

This is just one example, and it really is over-simplistic in a complex market, but if you have the mindset of "where can I hide so they won't find me" while still keeping your risk levels in mind, then your stops shouldn't get triggered so often on those trades that end up turning your way.

At what point is my trade no longer valid?
You place a trade because you believe a trade will move in a certain direction, you can picture it in your minds eye, you can imagine how the trade would go. A stop loss should protect you against bad decisions, so place your stops at levels that would tell you your decision was wrong. If that point is too far away from your entry for your risk level, then perhaps you are entering the trade at the wrong time.

Where do I think things will go to?
This question is brought up many times in relation to risk and reward scenarios, however I think of it differently. If I picture that the EUR will be moving 10 pips down in the next hour, but to keep myself safe, I need to hide my stop behind a resistance level 20 pips away, then I don't reject the trade because I don't like the risk reward ratio, I reject the trade because I should actually be thinking about where to enter a long position rather than catching the tail end of a move down.

If in your minds eye you see a pair about to retrace slightly before bouncing, take the bounce trade .. not the last bit of the retracement, if you'r minds eye picture was right, you are in for a much more profitable trade.

There is nothing wrong with being wrong, it is human nature to avoid defeat, to not want to admit you are wrong. It is more prevalent in males, which is why it wouldn't surprise me if females made better traders, but that is a discussion for another time. What matters at the end of the trading day is your pip balance, is it positive or negative, not whether you were right or wrong.

So suck it up, place your stop losses and be prepared to be wrong, there is no pride to be stuck in losing trades that keep you out of the most lucrative market in the world, as they say ... "You gotta be in it to win it".

Theory: Pivot Points

Ok, it seems there are a whole bunch of people asking about Pivot Points in the chat room of Marketiva, so I thought Ill give you the theory on it, and let you all work out how to trade it. I know of a few professional traders who use pivots in their trading system, and there are a few on Marketiva as well, myself and peterb are two who come to mind.

Alright so here we go.

Pivot Points are interesting guides, and in a sense they are reliant on people using them for them to work, a self-fulfilling indicator in a way, well at least that is the way I see them. Pivot Points are worked our from the previous days, High (H), Low (L) and Closing (C) values. From these values we generate five different values, the Pivot Point (P), Support 1 (S1), Support 2 (S2), Resistance 1 (R1) and Resistance 2 (R2). Some also include a Support 3 and Resistance 3 but I can't remember the formulas for those :). Now I don't pretend to understand why the formula's are as they are but in case anyone has the urge to know, here they are:

R2 = P + (H - L) = P + (R1 - S1)
R1 = (P x 2) - L
P = (H + L + C) / 3
S1 = (P x 2) - H
S2 = P - (H - L) = P - (R1 - S1)


Rather than just spit you out a text book explanation of what these are used for, you can get that from a simple google search, this is how I have observed them so far.

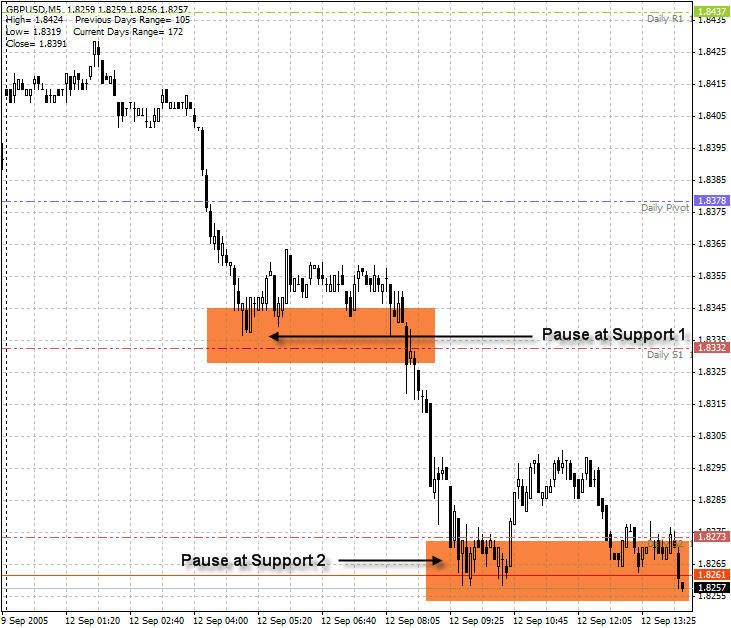
The Pivot Point are supposed to identify an "equilibrium" point, a level that prices could gravitate back towards during a days trading. Personally though I think the two most important levels to take note of are the first Support and Resistance points, R1 and S1. As prices move towards these levels, you almost always see a pause in the move, sometimes even a reversal. So if you are in a trade and are nervous about its movement continueing, a good place to re-evaluate your position is as prices move towards these points.


If you are looking for a reversal, these are also good points to look at your indicators, and if they are showing signs of a reversal, the nearby support or resistance point should give you some extra confidence. Be careful though, as there are occasions where the price is merely pausing as it approaches or hits this significant point, before moving on with the current trend.

So in summary pivots:
  • Show predicted ranges for the prices movement of the day
  • Give indications of where prices might pause
  • Give indications of where prices might reverse
So why do these work so well? One mode of thought is that as so many people use them as an indicator, then a lot of people sell/buy/wait at these points, hence my point, if a lot of people are using them, then they work, if not, then they are no more useful than a randomly drawn line on the chart.

I don't know if that makes things any clearer or not, but that is my understanding. You can use an online pivot point calculator here at fxstreet, or download one for your desktop here.

Theory: Moving Averages

Hi again all, well there have been quite a few newcomers into the chat area of Marketiva asking a questions something like "How do I play this game?". After the barrage of "it is not a game" replies, usually the talk moves to setting the user up with Moving Averages on their charts (usually by peterb). So, to make his explanations easier, here is the basic rundown of what moving averages are and what they are for from a beginners perspective.

Most people would realise that an "average" is simply the sum of numbers divided by the number of numbers. So the average of 4,7,4,6,4 would be 5 (4+7+4+6+4 = 25 divided by 5 = 5). So a "Moving Average" is simply an average of a series of numbers, but over a period of time. So let's say we have a series of 10 numbers, a "5 Moving Average" would be the average of 5 of those numbers, but which ones? Let's look at an example:

1 2 3 4 5 6 7 8 9 10

Above are 10 numbers, from 1 to 10, if you take the the first number (1) as day 1, and the last number (10) as day 10, then we have a 10 day history of numbers. If I ask you what is the 5 period Moving Average on day 2, your answer would have to be "1", as there is only one day of history available, that being day 1. How about if I asked you what is the 5 period Moving Average on day 6?, then the answer would be "3 stupid", because you have added the last 5 days of history,and divided it by 5 (1+2+3+4+5=15 divided by 5 = 3).

Now what about if I ask you on day 10 what the 5 period Moving Average is? I would hope that, firstly you wouldn't tell me to stop asking you stupid questions while you are trying to make money, but you would also say "7" because you have added the last 5 days of data together (9+8+7+6+5 = 35 divided by 5 = 7). So you can see, as you move along the series, the old ones (more than 5 periods back) are dropped, and the new ones are added. This is what is known as a Simple Moving Average (SMA), and is the easiest to explain in laymans terms. It's simplicity is essentially it's downfall for some, as each new number effects the average twice, when it comes in, and when it drops out, which can distort the results, especially if the number is huge. Imagine we put the number 100 into that series of numbers, when it came in, it would push the average really high, and when it dropped out, it would push the average down sharply.

To counter this effect, another type of Moving Average was developed, this being the Exponential Moving Average (EMA) which doesn't drop the old ones as quickly, but slowly squeezes them out over time, this has the effect of smoothing the average out and to eliminate some of the inherent lag that is in a Moving Average (as it is looking back, not in the future, so it is "re-active, not pro-active"). Now I am not going to even try to explain that one, cause well, I can't, but just know the common belief is that an EMA is more responsive and accurate than a SMA and are probably the most talked about so if it is good enough for them, it is good enough for me.

So you're probably thinking "ok that's all pretty boring, just tell me how to make money with them", well here is the theory. Lets start with a pretty picture:


This is a typical looking candle chart of the EUR/USD with two Exponential Moving Averages. The green line is a 10EMA, or 10 period Exponential Moving Average, the red line is a 30 EMA, or 30 period Exponential Moving Average. Now the higher the number, the further back in time it looks, which means the most recent value has less immediate effect cause we are averaging a greater amount of numbers. This is sometimes referred to as a "slow line" as it moves, bends and turns slower. You can see the 10 EMA moves in sharper turns and react's to price changes quicker as the last value has a greater effect on the numbers being averaged due to there being less of them.

So how do we use them? Well the lines serve to "smooth" or "average" the price direction, so if a Moving Average is moving down, then the average trend for that period is down, and of course it works the other way too. Above you can seem a few up and down arrows, these signify when the average lines "cross over" each other during the day. What does it actually mean in terms of the market place though?, if a short term EMA, such as the EMA 10 in this case moves below the mid or long term EMA, such as the EMA 30, it means current prices are on average below prices of 30 periods ago, this then is taken as it being in a downtrend, if it moved above than the opposite applies.

I have marked the crossovers in the chart with arrows, down arrow for when the 10 EMA crosses below the 30 EMA, and an up arrow for when the 10 EMA crosses above the 30 EMA. Some traders use these cross overs to enter trades, entering Long (Buying) at the up arrows, and Short (Selling) on the down arrows. This can be a good tool, but remember, the EMA lines are looking back in time, not forward, and so cross over after the price change itself, which means it could be too late if the move isn't great, especially on short term charts. Another way to use them is to use them as a "filter indicator" which means combine them with another indicator that might indicate a turning point to confirm the strength of a movement. If you have an indication the price is going to drop, and the EMA 10 crosses below the EMA 30, that should give you some mroe confidence on taking that trade.

How you use them is really up to you, and what periods you use for them also is up to you, and quite often depends on the time frame they are being used on. It will also depend on how long you are wanting to hold a trade, no use using a EMA that is looking back 2 weeks if you only want to hold it for 1 hour, as it will mean nothing and will turn way too slowly.

One last thing, look at the yellow areas above, here you can see where the EMA 10 moved to cross the EMA 30 but failed, this can catch many investors out, and if you have not placed a stop loss, quite often your losses can be large, so be careful and find other ways to confirm your suspicion of the move.

I hope this helps you all on the path to riches, Moving Averages are a great tool that should help you all in identifying the trends and turning points of a market. Remember "The trend is your friend".

Happy trading!


Theory: Indicator Types

Indicators, any beginner is bound to hear that word a thousand times as they try to figure out what to use when trading. There are literally thousands of them out there, Oscilators, Histograms, Trend lines, Channels, indicators that measure momentum, some that measure oversold and overbought conditions, ones that measure whether you are smart enough to trade ..... ok maybe not those ones (but if anyone knows of them let me know ... I am having some doubts), so just what do you use and how do you use them?

Well here is the answer, if you want to make millions of dollars you need to use ................ oh come on as if I would know! .... noone can tell you what to use, and even if they do, there are so many variations and settings that even if you are using the same indicators as someone else, you could have different settings, and even if they are the same, everyone interprets the signals from these indicators differently.

Now I am not an expert on any indicator, actually I am not expert on anything to do with Forex at the moment :) (hence the quest for the "am I smart enough" indicator), so I won't be able to explain the finer details of what indicators show, but there are some general principals that I have picked up in my travels so far, and as I have a memory like a sift (that is the round thing with lots of holes in it for those that are "cooking challenged"), I figured, lets ramble on about them here and maybe I won't forget them in the future. So ...

Well I think sooooo ... kinda .. well you know .. maybe ...


Heard something like that before? If so you probably have a teenage sister/daughter/cousin and it is the classic response of someone who think they know, but don't want to commit for sure (no comment from the women please!). Well this is how I think about indicators, they tell you something, but don't take it for granted, they are called "indicators" after all, so while they might be able to clue you in on a possible movement in a particular direction, you need to seek confirmation from other sources, such as the price movement itself or other indicators that tell you different things. That brings me to:

Me and billybob ... we's like peas and carrots ...


Ok that isn't the exact line out of Forest Gump, but there is a message there for us beginner traders. There are so many indicators that it is easy to end up with all sorts of lines, bars, colours and arrows floating around the screen. I have seen many a trader complain that the 3 different indicators told them the price was going to go up, and instead it went down! (ok that was me). So why would this happen? Is there something wrong with the indicators? Perhaps some news came out that reversed things, maybe I have my monitor upside down! ... all of these things could be the case, but for us beginners, I bet it is because those three different indicators were all of the same type, so they were simply confirming the same thing three times, essentially three sisters who were in the same place at the same time looking from the same perspective, all saying "well maybe kinda" at the same time! Before you can believe them, you need to get confirmation from another source, someone else who doesn't have a phone surgically attached to their ear, somone with a "different perspective". There are different "types" of indicators, or indicators that tell you different things. Some of these are:
  • Trend indicators
    These are handy little buggers that tell you which way the market it trending (fancy that ... Trend indicators telling you the trend .. who would have thought), which can either be up, down or sideways. Some examples of these might be Moving Averages or Trend lines.
  • Strength indicators
    A group of indicators that signal the force behind a move, I have very little exposure to these but I believe Volume is a good one for that.
  • Volatility indicators
    Volatility, or how much price is moving between extremes in a given time frame is another group, something like Bollinger Bands is a good example of this type.
  • Cycle indicators
    Cycle indicators are there to signal repeating market movements, a bit like the tides, some markets supposedly move in cycles, which means if you can identify them, you get a head start on your trades. Elliot Wave theory is a good example of this kind of indicator.
  • Support/resistance indicators
    The most common type of Support and Resistance indicators is good old manual trend lines. These serve to indicate when an iminent price move may be underway.
  • Momentum indicators
    Momentum indicators help you determine if a trend in progress will continue, or is on it's final legs. They can also be used to try to indicate upcoming turning points. Some examples would be the RSI, MACD or Stochastic indicators.

So if you are using three indicators, and all of these indicators were momentum indicators, then there is a good chance that all these would tell you the same thing, giving you a false sense of security. So when developing a trading system of your own, try to pick an indicator of your choice from different families to ensure your signals are more reliable. In a word, diversify.

Another trick is to look at using these indicators on different timescales. If a 1 hour chart indicated a strong down trend through a trend indicator, the prices were rising on a 15 minute chart but a momentum indicator was giving you an overbought signal, then a possible resumption of the long term trend could be on the cards. You could then move to a 5 minute chart to find your entry through an indicator that is showing you if something is overbought or oversold, hence showing a possible turning point. That is the theory anyway.

Now I can't tell you which indicators to use, cause ... well I can't figure out which ones I like myself yet, but if you are aware of not using too many from the same family, it will save you a whole bunch of confusion and many a thumped desk.

One last thing, more than likely at some point you would have looked and tested so many indicators that you will be all confused out which is the best one, my tip, stick to the indicator you first saw and went "aaawww yeh I get it". Chances are it is just as good as the others, and it was the one your brain processed first so will most likely be the one you will be able to interpret the best.

Ok happy trading for the upcoming week! See you all later.

Theory: Forex 101


A bear chased two hikers. One hiker, while being chased, stopped to put on running shoes.

As he was changing out of his hiking boots, his companion looked at him in horror and exclaimed, "What in the world are you doing? You'll never outrun the bear if you stop now!"

Calmly, the other hiker said, "I don't have to outrun the bear. I just have to outrun you."

This is a fantastic quote in a small e-book I just read from robbooker.com and describes the forex market wonderfully. You can never beat the market, but you can beat other traders. To help you on that journey, here is an introduction to the very basics of trading Forex.

Forex, Foreign Exchange, FX ... whatever name it goes by it can be a daunting thing when you first encounter it. There are so many terms and concepts to understand that without some guidance it can become "all to hard". So in response to the requests I have received, here is a beginners guide to the basic concept of what Forex is.

Currency Pair

A currency pair is a representation of one currency against another. For example one currency pair is the EUR/USD, or the Euro to the US Dollar. If the EUR/USD is listed at 1.2150, you read this as 1 Euro will but 1.2150 US dollars.

Pip

Learn to love this word, because this is what you will be seeking for the rest of your forex career. A pip is the smallest denominator of a particular currency pair, so for the above example, if the EUR/USD moves from 1.2150 to 1.2155 then it has moved up 5 pips.

Leverage

This one I'll leave to robbooker.com:

Leverage is a simple concept. If you have $10,000 to trade with, your forex broker will let you borrow money from him so that you can trade in larger quantities. They will let you borrow as much as 400 times (400:1) what you put up in a trade. Most brokers allow between 50:1 and 100:1 margin. So, if you put up $1,000, and your broker allows 100:1 margin, then you'll be trading $100,000 worth of currency (instead of $1,000).

That's important, because every pip equals a certain dollar amount. When you trade $10,000, each pip movement equals $1. The chart below shows how it goes from there. If you trade 10,000 worth of currency, each movement would be equal to $1. So if you bought at 1.1445 and sold at 1.1545, you would make 100 x $1, or $100. If you trade $100,000, each pip movement would equal $10 and so on.

Going Long and Short

Now there is two different ways you can trade on the forex market, and many beginner traders are surprised to learn that you can actually make just as much money when a currencies price moves down as you can when it moves up. Let's start with the most logical movement, when the price moves up.

Most people are very familiar with the concept of buying something at a low price and selling it when the price increases. So the concept of buying the EUR/USD at 1.2150 and selling it at 1.2160 for a 10 pip gain should seem logical. This process is called going long.

However, you can also do this in reverse! If you think you know that a currencies price is going to go down rather than up, the you can go short. This is just the opposite of the above transaction, selling it first and buying it back later in the hope that the price will go down for you to make a profit.

This can be somewhat strange for those hearing this for the first time, but the concept remains the same either way, that being, that you always want to buy something at a low price, and sell it at a higher price than you bought it at. Which order you do it in doesn't matter, just that for a transaction to complete you must both buy and sell, as long as you sell at a higher price than you buy then you make profit.

Spread

The difference between the stock markets and the forex market brokers, is that in the forex market, broker commissions are either very low or zero. So how do the make money?, they make it from the "spread" or the difference between the actual price and the offered price through a broker.

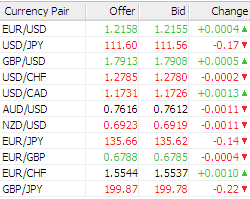
To the right here you can see a typical board of currency pairs and their spreads. This one is taken from Marketiva this morning, and you can see for example the difference between the Offer (the price you can place a sell order) and the Bid (the price you can place a buy order) is 3 pips (the spread).

What does this mean to you though?, well, let's look at the board, if you bought the EUR/USD at 1.2158 as it is offered under the Offer column, and immediately sold it again before the price moved, you would only get 1.2155 as is shown in the Bid column. So the net result is -3 pips, or a loss to you, and a profit to the broker. Remember to always take the spread into account when placing a trade, setting targets and stop losses.

Stop Losses and Profit Targets

This is something I will go into much more in upcoming articles, but it is something that I view as vital for all beginners to understand. When placing a trade, the price has the potential to do three things, move up, move down or move sideways. If you are long in a trade and need the price to go up, what happens if you pop into the kitchen for a cup of tea and when you are gone the price drops dramatically? Remember, on a full forex account, each pip can equal $10, so any movement in the opposite direction can of course lose you money. A stop loss is your protection against big losses.

Placing a stop loss is like doing up the zipper of your pants ... you don't have to do it, but it is damn embarrasing when you get caught out!

The same applies for the other way around, if the price moves in your favour while you are away, before dropping again, if you are not there to close the trade at a profit, you may have missed your opportunity. A profit target is a place to take your profits.

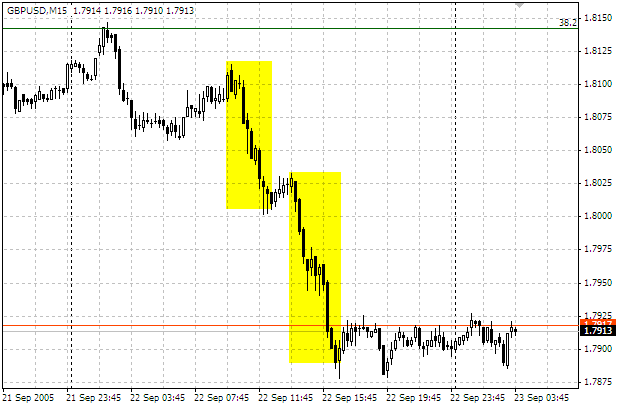
When you place a trade you can set a price where, if it moves to that price, the trade will automatically be closed for you. Setting this price in the opposite direction of what you want the price movement to be is a "stop loss", or a level where your trade is "stopped" to minimise your losses. Now you may think "well how bad can it be" ... have a look at the below 15M chart from yesterdays GBP/USD.

Look at the two highlighter areas, if you had place a long trade (i.e. you think the price is going to continue up) as the price started to move upwards after the first initial drop (the first highlighted area), thinking "well that is the end of that move", then walked away without a stop loss, you would have been in some real mess 3 hours later when the price dropped again another 154 pips, or, on full account $1540!!

The Bears and the Bulls

You will constantly see the term "Bears" and "Bulls" in forex books and chat rooms. So why are we talking about animals when we are supposed to be trading? These are terms that describe the general mood of the market. A "bear" market, is when the general mood of the market is down, i.e. when there are more sellers than buyers in the marketplace. A "bull market" is the opposite, when there are more buyers than sellers and the general mood of the market is up.

Forex and any other marketplace, is just a struggle between the bulls and the bears, it if you can identify who is gaining the upper hand, then you can identify the direction of the price. Easier said than done of course.

Well that about covers the basics, there are so many more areas to cover of course but I hope it helps those starting out in this exciting marketplace. If I have missed something you wanted to read about please leave a comment below and I will be sure to add it to the article if I can.

Best of luck to you all!

Theory: Fibonacci

Hey all,

First of all, very sorry about the lack of updates the last couple of days, but would you believe TODAY is the due date of baby Akuma, but of course, I would not be writing this if it was on it's way ;). My trading activity has been very low lately, but Ill be sure to post at least the results soon, but instead, I thought I would put together a new theory article for you all, this time about Fibonacci.

Fibonacci was named after a mathemetician and trained accountant by the name of Leonardo Pisano in the 1100's (ah yes I remember them well ... those were the days). He came up with, amongst other things, a series of numbers that is now referred to as the Fibonacci sequence, where each number is the sum of the two numbers preceding it. Here is the beginning of it, and of course it goes on to infinity:

1, 1 (1+0), 2 (1+1), 3 (2+1), 5 (3+2), 8 (5+3) etc.

Pretty simple huh! ... this guy is famous cause of that simplicity though, which gives us all hope ;). Anyhow from these numbers a whole bunch of ratios can be taken from them, now I'm not going to pretend to understand them, but the main ratios, that are reproduced through the world, in nature, buildings, cells, ice cream ... ok not ice cream ... are:

0.236, 0.50, 0.382, 0.618 ...

There are many more, but these are the main ones to concern us beginner traders, and here is why. Quite often in the liquid markets of Forex, prices respect these levels when they move, meaning, just like Pivot Lines, prices will quite often pause, and more often reverse at these levels. Most charting packages have the ability to add Fibonacci lines to your charts, for example in Metatrader 4 all you do is; if the price was moving down, drag a line from the recent peak, to the most recent bottom and the lines are added for you. Unfortunately Marketiva does not offer them as yet, however here is a chart with them drawn:

The blue dotted lines are the fibonacci lines that correspond to the ratio's I was talking about. You can see in the move up, that the 38.2 fibonacci line formed the point for the price to reverse its retracement and continue with the trend (support). Of course, any of these lines could have been the points of reversal, but a reversal at the 38.2 line is a good sign that the trend will continue as the retracement was shallow.

The other line that I find most commonly hit is the 61.8 line as shown here:


Be a little more wary when such a deep retracement occurs, as it is less likely (although not in the above case) that the previous support will be broken again.

So what do you do with this knowledge? Can you trade with fibonacci alone? In my opinion, no as you don't know which line will be the turning point without the aid of other indicators or reading the price action, but they can be an excellent addition to your trading system to confirm other signals. For example if you have a signal from another indicator telling you a reversal is about to happen, and price is hovering at a fibonacci line, this might give you added confidence to place the trade.

Happy trading!

Theory: Divergence

If you have been around Forex chat rooms or forums for any amount of time, one term you would have heard of many times is Divergence. While by no means a fool proof indication, it is a nice thing to store in the back of your already full brain to help you in confirming suspected trend changes.


Above is a snap shot of the hourly chart of AUD/USD in the week just gone (click on it to see it larger). Divergence is essentially when an indicator is trending in the opposite direction to the price. You can see in the above chart, a trend line clearly shows the price at this time is making a series of lower highs and lower lows, so it is in a clear downtrend.

Below that is an indicator called the Stochastics, with settings of 15, 5, 5. Here you can see that as the price is making lower lows, the indicator is making HIGHER lows, so the price is downtrending, the stochastic indicator is in an uptrend, this is Divergence.

When you see this occur, look out for a sign of a reversal of the current price trend, in this case, it happened when the price broke the trend line as indicated by the orange area. I don't trade this method currently of course, but it something good to know, and something to look out for if you are trying to figure out if the trend will continue.

Best of luck, hope it helps.

Theory: Compounding

Good afternoon all and I hope you are having a great weekend!

It has been a while since posting my last theory article, so let's get back on the bandwagon and talk about the trading and compounding. I think it is most traders dream to be able to escape the rat race, tell your boss where to go (that's if you don't like him/her of course) and let you trading skills lead you on the road to riches. I'm also sure a lot of you would have heard the saying "it takes money to make money" (if I hear it one more time .. arrgg), which to me is kind of deflating, why can't someone with very little money make money? Well pleasingly, for all of you that aren't driving a BMW and spending their weekend on their private yaughts, compounding is most likely a big part of your solution, so let's look at why.

The easiest and most used analogy when describing compounding is the good old snowball, which to me, living in "the sunburnt country", is somewhat foreigh so i'll have to draw on the imagination for this one. In trading, compounding is when you add your previous earnings onto your existing account size and adjust your trade size accordingly. Umm ok let me try to explain.

Let's look at the two trading scenarios, let's say you have opened a mini account with $1000US, this traditionally would let you trade "mini lots" or lots of 10,000 in size, where each pip would equal $1 US approximately (depending on the pair). If you make five "mini lot" trades on the GBP/USD, with each trade earning you 50 pips, you would have your original $1000 plus 5x$50 ... so $1,250 all up (as well as bragging rights for your 5 straight winners of course). This is just like someone packing a tiny snowball, rolling it down the hill five times, and each time you dusting of any excess snow that acumulated from the previous roll before rolling it again. (can you tell i'm struggling with the whole snow thing).

Now let's look at the same trades but include compounding in the scenario. Remember compounding is adding the previous winnings to the account and adjusting your lot size according to some rule. So , from the previous example, after trade 1, our account has gone from $1000 to $1050 (50 pips at $1 each pip). A gain of $50 on a $1000 is a return of 5% of your account, so one compounding strategy would be to increase your lot size by the same amount. Now we are trading lot sizes of 10500 (500 is 5% of 10000), so each pip now equals $1.05. This means trade 2, which returns 50 pips now earns you $52.5 instead of $50, moving your account to $1102.50 instead of $1100. In snowball terms, it is like taking that small snowball rolling it down the hill five times, but each time leaving the excess, and just rolling it right back up there to acumulate even more. (gee im glad that snow thing is over with).

... compounding really is a great tool for all those that can't subscribe to "it takes money to make money" ...

Now what we really want to know, what does it mean to the road to riches? Well if you can make let's say a 50% annual return on your account (certainly acheivable), this time in around 17-18 years you will be a millionaire, sipping a cocktail on a beach somewhere in the bahamas (unless you live there, in which case that would kind of be pointless ... anyway). If you can make a 100% annual return then somewhere around 10 years you would make your first million, not bad from $1000US. The beauty of us as traders is we are not restricted to compounding annually, monthly or even weekly as in a traditional savings account or managed investment portfolio, we can actually compound daily, or even trade by trade.

Compounding really is a great tool for all those that can't subscribe to "takes money to make money", and an even better weapon for those that can.

Happy trading!

Theory: Chart Correlation

Hi all,

I thought I would mention a very simple concept that I know a lot of traders know of, but there may be some who don't. The concept is of chart correlation, i.e. when one pair goes up, another pair goes down.

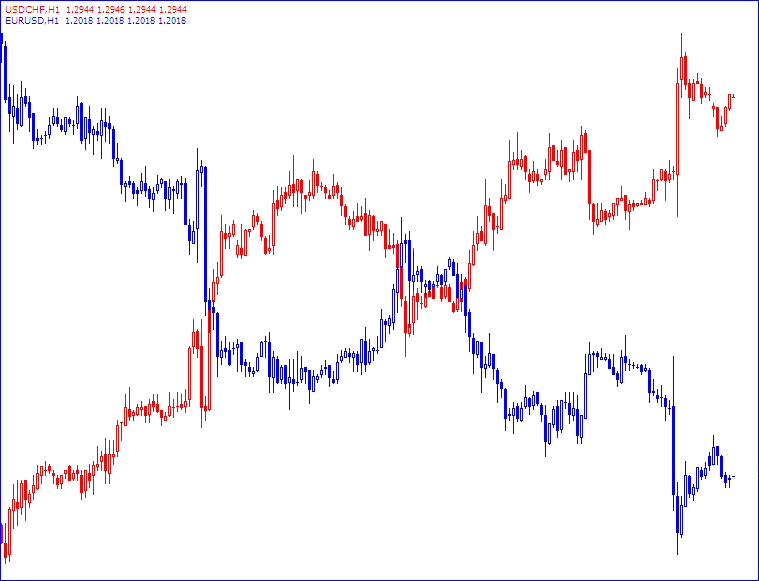
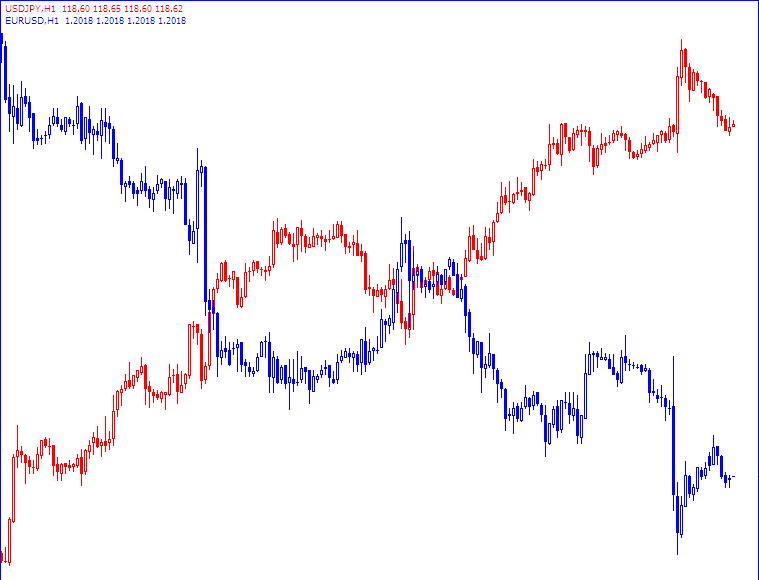
This concept is especially true for all the majors and there is a very simple reason why. All the majors have one thing in common, the USD, in general it is the USD that drives the pairs up and down, there are of course the odd exception with region specific data releases etc, but as a whole it is the USD that drives things. So if the USD gets stronger, then more than likely the USD/JPY will rise, while the EUR/USD will fall. Don't believe me? Let's look at some charts I have prepared earlier ;), I have overlayed and coloured them to make them easier to compare:

EUR/USD 1H over the USD/CHF 1H

You can see they are practically mirror images of each other. Now how about two pairs with USD as their base currency, lets look at the EUR/USD again but against the GBP/USD:

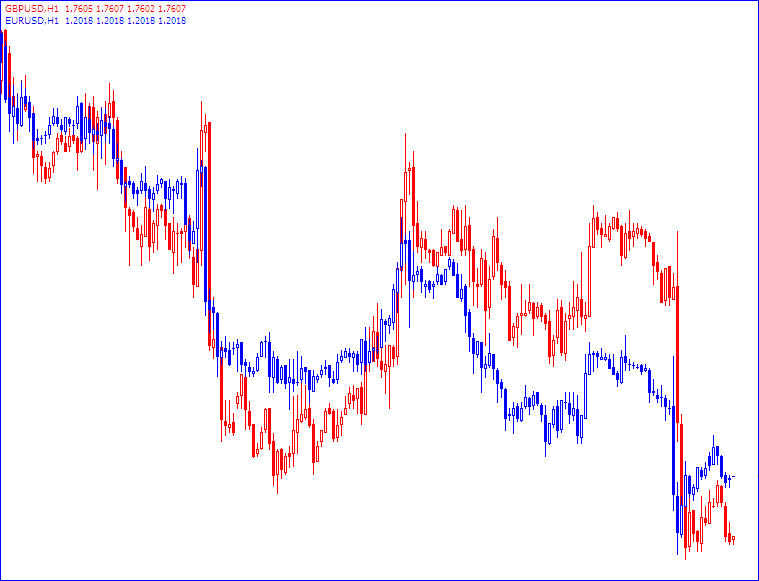
EUR/USD 1H over the GBP/USD 1H

You can see they play follow the leader for most of the time. You can see then that most of the time, it would be contradictory to have a swing trade short on the EUR/USD and a short on the USD/CHF at the same time, one is doomed for failure. You can compare all the majors and the action is essentially the same, here is the EUR/USD over the USD/JPY:

EUR/USD 1H over the USD/JPY 1H

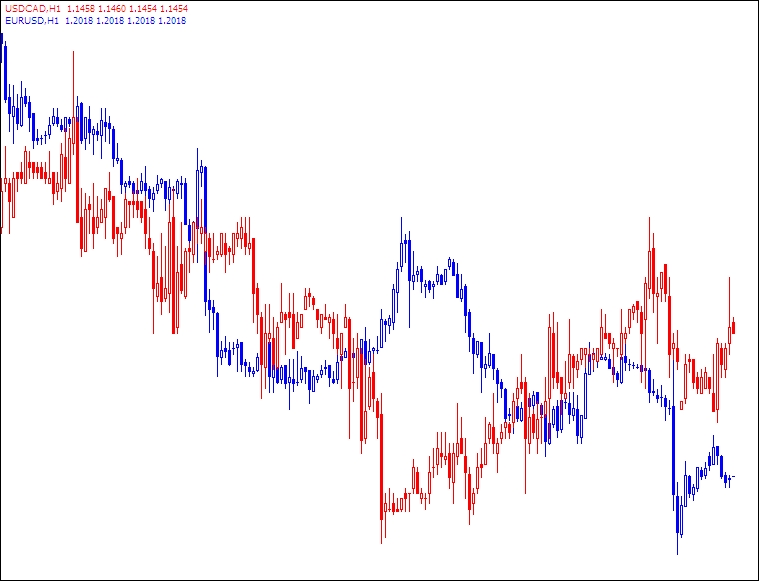
I think I have made my point. There is however the odd exception, although not amongst the majors, currently that "black sheep" is the USD/CAD. You would expect, with the USD as it's base also it should follow the pattern of the USD/JPY and the USD/CHF, but, as it is a commodity and energy reliant pair, and considering the current energy crisis the world is under, the USD/CAD currently is leading it's own life. Here is the EUR/USD over the USD/CAD to show you what I mean:

EUR/USD over the USD/CAD

You can see, apart from the new year action that for quite some time the USD/CAD bucked the trend, and moved in the same direction as the EUR/USD as demand for oil prices rose, gold hit new 5 year highs and the canadian economy was going great guns. If you have a charting package that let's you overlay charts, then it is well worth doing every now and then to see how pairs are moving compared to others, it just may stop you trading against yourself.

Happy trading!

Theory: Candlesticks

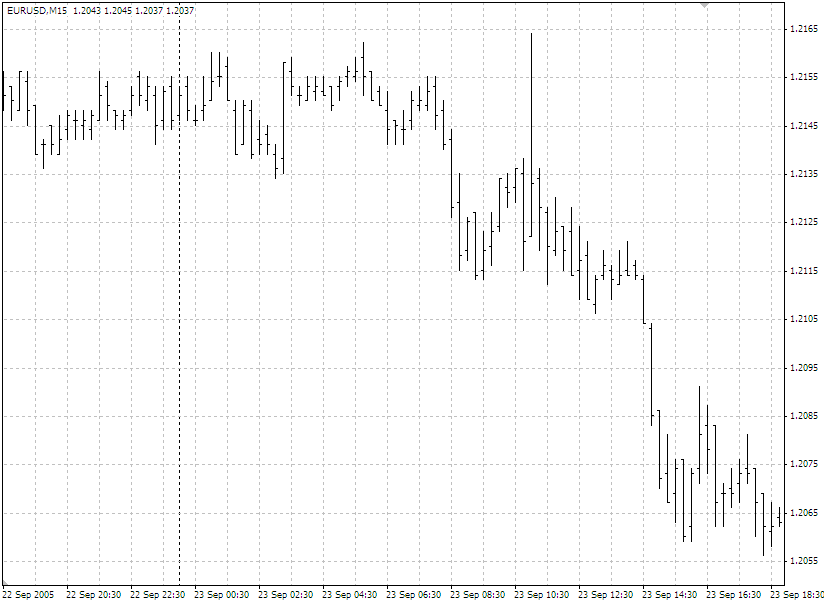
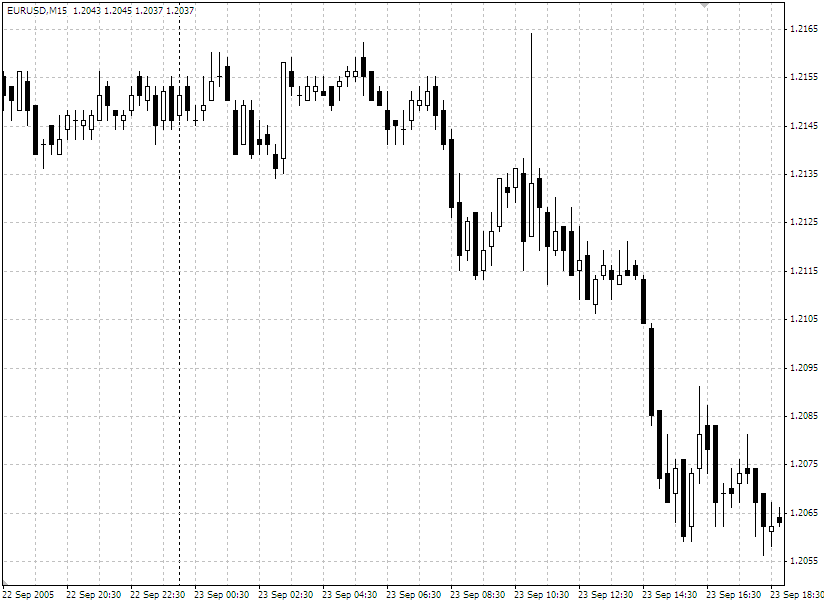
Hi all, today I'll have a quick chat on the theory of Japanese Candlesticks. In case you did not realise, there are three main ways to view a trading chart, you can view it as a line chart, a bar chart, or a candlestick chart. Below are what each of these look like:


Candlestick's were first introduced in the 1600's, strangely enough to analyze the price of rice contracts. There is no special calculation, they are simply an alternative way of representing current prices. Below is the basic rundown of what a single candlestick looks like, and how it is interpreted.

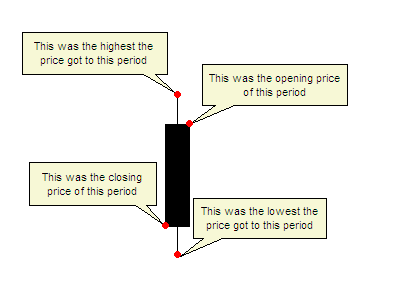
This is a candlestick you would see most often in a downtrend, with the black body being a sign that the closing price finished lower than the opening price.

Here you can see labelled the opening, closing, high and low of the particular period that this candle is representing, which could be 5 minutes, 1 hour or 1 day depending on what chart you are looking at.

Some charts have candles that represent this scenario coloured in red, either way, the main thing is to remember that usually this type of candle will usually be filled.

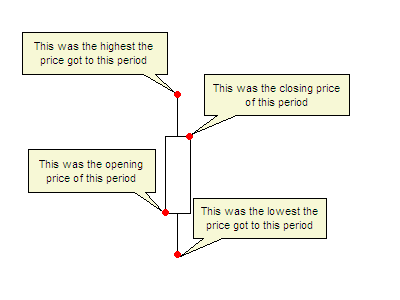
So that is what a "down" candle looks like, a candle representing the opposite scenario, i.e. when the closing price finishes above the opening price usually is white, or uncoloured and looks like below:

You can see that the main difference between this candle and the above candle is that the closing price is above the opening price, indicating that during this period, the price went up during this period.

Some charting packages will show this candle as a green candle, some as white, or some with no colour at all, just an outline. If you set the colour scheme yourself, just recognise that you need to make this candle different to the above candle so you can distinguish the difference.

Now if I was to run through every type of candle that existed in the theory of candlestick charts, I would more than likely get cramp and brain freeze, and not finish this article. So instead, I will run through some basic deduction you can take from interpreting a few different types of candles.

Have a look at this candle (called an inverse hammer), you can see the main difference between this candle and the basic candle I showed you above is the lack of a thin line below body (the thicker white area) of the candle. So what does this mean? The thin lines are refered to as "wicks" or "shadows", and represent when prices move up or down, but are then dragged back.

How to read this candle? Well here the price closed well above it's opening price, there was a push for higher prices as represented by the upper wick, which was pulled back slightly. Depending on the market, you may read this as a sign that price will continue with the upward push, as the price didn't retract too far, and there was no real push for lower prices.

Ok here is another (called a hammer), the inverse of the previous candle, here you can see the closing price was lower than the opening price, hence the black body of the candle. It has a medium length wick also, which again is a sign that there was a move to push the prices lower. You make this candle to be a sign of strength in a down move, or a sign of a reversal, or pause in an uptrend.

To me the wicks are just as important as the bodies of candles, and should be taken into as much consideration as the colour and length of the body. Now there are a bucket load of different candle types as I mention earlier, but to give you an idea, here are a few that I find to be the most telling when reading candlestick charts.

This candle is referred to as a "doji", and you can see has very little, or in this case no body to it. This candle is a sign of indicision in the market, as the wicks above and below the non existant body reflect that there was a push up, and a push down, resulting in a stalemate with the opening price and the closing price being the same in the end.


This candle, a hammer, is a strong sign if seen at the bottom of a downtrend, when you suspect that a currency may be oversold. Here you can see a very long bottom wick in comparison to it's body, and tells the story that prices made a strong move down, but was dragged back above it's opening price, hence the white body. A candle with such a long wick as this, is usually a good sign that the momentum of a downward move is stalling or reversing.


Here you can see a variation on the inverse hammer candle I showed you previously, with the main difference being that this one having a much longer upper wick, and the closing price finished below the opening price. This candle can quite often be a sign of a change in momentum, as the strong push to higher prices, as shown by the long upper wick, was pulled back so far that the prices closed lower, a sign that future pushes to higher prices may be rejected. This candle is especially valid in an uptrend where you may suspect that a currency is overbought.

There are so many more, and I haven't even touched on combining these candles into different formations. I have however, provided a link to an e-book on this subject that covers all the basics in a text book fashion that can be a good reference for you all.

Please do not take this candles as given, like any other indicator, they are just guides that can help you, but it is always safe to look for confirmation either in the next candle or with other indicators. Oh and one last tip, never trade on an incomplete candle, always wait for that period to end before assuming the candle is a certain type. Quite often the biggest moves are at the end of the period you are looking at, and what you thought was one type of candle become something completely different in the matter of seconds.

Best of luck with them, I personally feel candles tell you much more than a line graph ever could, and while bar charts can tell you the same information, I find candlesticks much easier, and more importantly, much faster to read. Please leave a comment if there is something vital I have missed.

Happy trading!